Valuation Of Intangibles And Trademarks— A Rehabilitation Of The Profit-Split Method After Uniloc
Christof Binder, PhD, MBA
Trademark Comparables AG/Markables, Partner
Schwyz, Switzerland
Anke Nestler, PhD, MBA
Valnes Corporate Finance GmbH, Partner
Frankfurt, Germany
Introduction
A profit-split analysis for a trademark or other intangible asset attempts to quantify what share of the profit of the business is attributable to the subject asset. Based on this asset-specific profit, its value can be calculated. Despite the adverse Uniloc decision of the U.S. Court of Appeals for the Federal Circuit in 2011,1 profit-split is an important, if not essential, element in the valuation of intangibles. In the wake of Uniloc, the method needs not only a vindication, but also a refinement based on case-specific facts and data. Purchase accounting data reported in financial statements can provide both.*
Profit-Split In a Nutshell
The profit-split method is one of the oldest and most frequently applied methods for the valuation of intangible assets. Basically, profit-split attempts to allocate the total profit of a business to the different assets that contribute to it, including the subject intangible. The key element of the profit-split method is the derivation of an appropriate or reasonable profit-split percentage based on which a part of the total profit is apportioned to the subject intangible.
Textbooks on IP valuation suggest three different variants of the method to arrive at a profit-split percentage.2According to the overall profit-split method (OPSM) or contribution profit-split method, the combined profits earned by two parties from a transaction (i.e. a licensing transaction) are divided between the two based on some allocation principle.
Under the comparable profit-split method (CPSM), the profitability of comparable businesses with comparable IPs is analyzed and applied to the subject business. Comparable profits describe the typical profitability of comparable businesses, including the full cost or expenses for the IP. The subject business calculates its profitability before charges for the subject IP, and then adds a reasonable IP charge to arrive at a comparable profitability.
The residual profit-split (RSPM) is a stepwise approach to allocate profits to different categories of assets. It starts with routine contributions to assets that are easy to value, i.e. tangibles or intangibles with a typical return rate. Thereafter, the residual profit is allocated to the remaining “special” IP assets of the subject business.
These three methods may sound simple, but in practice they are much more complicated. First, availability of data is limited. It is hard to find financial reporting data for comparable businesses with comparable IP, let alone accounting data about their IP. Further, there are no typical return rates for different classes of assets, at most for typical ranges of such return rates.
Another restriction of the method is that it is a typical chicken-and-egg phenomenon. The concept of dividing profits among assets is both the crux of the problem and its solution. If the value of the different assets and IPs was known, a profit allocation would not be needed. And if the profit-split to different assets was known, it would be easy to calculate their values. But it is an equation with two unknown variables. So, valuing IP by comparables or by residuals—as the profit-split method suggest—is easier said than done.
Having said that, how can it be explained that the profit-split method is one of the most frequently applied methods to value IP? Well, this is because valuation practice found two ways out of this dilemma. One is simplification, the other sophistication.
The problem of non-availability of data was first circumvented by simplification, or the so-called rules of thumb. As case-specific profit-split data was not available, valuation practice came up with some universal percentage figures presumed to be typical or average profit-split ratios for intangibles. In its early version, the rule of thumb said that 25 percent of the profit of a business is attributable to its IP. During the course of time, the rule was extended to different ranges extending from 10 percent to 35 percent. Further, the profit-split method was often downgraded to a secondary method used to corroborate or “sanity check” the results of other primary valuation methods. The good thing with this simplification was that— once the percentage range was commonly accepted— its results were easy to comprehend for uninvolved recipients like auditors, judges or bankers.
On the other hand, the profit-split method became much more sophisticated through financial modeling. Financial modeling is a tool to solve a valuation problem with different unknown variables and different assets to be valued within one and the same model. Typically, such models have some fixed limitations, for example, enterprise value, total profit, and WACC. The model simulates—within such limits—the unknown variables such that the outcome is most plausible. As a mathematical method, financial modeling is some sort of dynamic programming, where different parts of a problem (subproblems) are solved independently and then combined to reach an overall solution. Computer software greatly fostered the diffusion of financial modeling in valuation. However, its complexity results in reduced transparency; uninvolved recipients have problems to fully comprehend the results of such valuations. Therefore, financial modeling is the preferred method for internal use.
Profit-Split—From its Origins to Uniloc
The profit-split method was pioneered 50 years ago by Robert Goldscheider, one of the early masterminds in technology transfer.3 At the time, Goldscheider worked as special counsel in technology transfer and licensing issues for Philco Corporation, a consumer electronics company based in Philadelphia. Outside North America, Philco sold its products in 18 countries through licensing arrangements with local companies. The license agreements included various product technologies and patents, trade secrets and know-how, and a set of marketing intangibles including trademarks, photos, drawings and other copyrighted materials. Further, Philco supplied key components under favorable terms to its licensees. For this bundle of IP and supply rights, each licensee paid a royalty rate of 5 percent. All licensees operated successfully in their local markets.
After guiding the business and working with the licensees for two years, Mr. Goldscheider observed that the pre-tax profitability of each licensee was approximately 20 percent. Mr. Goldscheider concluded that “5 percent was a healthy royalty rate, and I was interested to note that it usually constituted about 25 percent of the profitability ultimately achieved by the various licensees.” This finding was the starting point for Mr. Goldscheider to investigate the influence of actual or potential profitability of licensing transactions on the setting of royalty rates. He observed similar patterns from later technology transfer and licensing arrangements. A revenue treatment ratio of 3:1 between the licensee’s and the licensor’s interests proved to be workable in a number of different transactions in unrelated industries.
These early empirical observations led toward the formulation of a pragmatic 25:75 baseline working methodology which generated businesslike results in the negotiation of license agreements, and were the starting point of the profit-split method. The 25 percent (or any other percentage resulting from a royalty rate) is the part of the profit of a business which relates to the IP used by it.
Later, the method was refined by the “next best alternative” available to the licensee. Starting from the baseline 25 percent ratio, a serious licensee would also consider the cost of the next best available alternative (i.e.developing the IP in-house, licensing other comparable IP, etc.) and compare it to the cost (royalty rate) at the 25 percent baseline profit-split ratio, eventually resulting in a lower or higher profit-split. Over time, the empirical 25 percent ratio of the early days was extended to a range from 10 percent to 35 percent, based on either net or gross profits, however, with its center point always remaining at 25 percent.
In the course of time, the method was frequently applied by valuation professionals in various situations for its simplicity, for example:
- For the negotiation of royalty rates in IP licensing.
- By many courts (especially in the U.S.) to corroborate the determination of reasonable royalty rates to compensate
for IP infringements. - In transfer pricing to check the remaining profitability of a business after applying arm’s length royalty rates for the licensed IP.
- In financial valuations of IP to cross-check
the feasibility of market comparables with business profitability. - In accounting and auditing for quick checks of IP on the balance sheet.
However, in 2011, the U.S Court of Appeals for the Federal Circuit brought an abrupt termination to the application of the 25 percent profit-split rule of thumb. In its ruling in a patent infringement dispute between Uniloc and Microsoft, it held that “the 25 percent rule of thumb is a fundamentally flawed tool for determining a baseline royalty rate in a hypothetical negotiation. Evidence relying on the 25 percent rule of thumb is thus inadmissible under Daubert and the Federal Rules of Evidence, because it fails to tie a reasonable royalty base to the facts of the case at issue.”4
The Court of Appeals further explained that this rejection is not meant to be a limit to general valuation principles, but only to the application of flat-rate schemes. “This court’s rejection of the 25 percent rule of thumb is not intended to limit the application of any of the Georgia-Pacific factors. In particular, factors 1 and 2—looking at royalties paid or received in licenses for the patent in suit or in comparable licenses—and factor 12—looking at the portion of profit that may be customarily allowed in the particular business for the use of the invention or similar inventions—remain valid and important factors in the determination of a reasonable royalty rate. However, evidence purporting to apply to these, and any other factors, must be tied to the relevant facts and circumstances of the particular case at issue and the hypothetical negotiations that would have taken place in light of those facts and circumstances at the relevant time.”
The rejection of the 25 percent rule of thumb underscores the importance of using facts of a particular case in calculating the reasonable value of IP. Having been widely accepted prior to this court decision, the 25 percent rule’s rejection is felt across the valuation profession in all different applications of the profit-split method. Valuators are now expected to provide comparable profit-split data for their subject case, which almost always does not exist and the lack of which was one of the reasons to apply the simple but comprehensive “rule of thumb” percentage ranges.
The Limitations of the Classic Profit- Split Method
Irrespective of the specific reasons that led to the rejection of the 25 percent rule in the Uniloc case, there are—and always have been—a number of conceptual limitations to the classic profit-split method:
- Bundle of rights. The license agreements in the original Philco example comprised a bundle of different IP rights, including patents, know-how, trademarks, copyrights and sourcing rights, at a royalty rate of 5 percent and a profitability of 20 percent. Each IP individually would have had a lower royalty rate, and a lower profit-split ratio. Thus, the actual profit-split ratio depends on the scope of the licensed rights.
- No market price. According to the principles of the profit-split method, the licensed IP does not have a typical market price. Its price (royalty rate) is determined by the cost and revenue structure of the licensee and the resulting profitability, but not by the price that other licensees might have paid for similar IP, or that the licensor could achieve for similar IP in previous licensing negotiations. In reality, however, the price for IP is sometimes what the licensor asks for—irrespective of the profitability of the licensee.
- No actual profits. The negotiation of royalty rates— and the resulting sharing of profits—is based on profit expectations of the licensee, but not on actual profits which might differ from expectations. Often, a license agreement relates to the subsequent launch of a new product or business. Depending on the source and the definition of failure, the flop rate of new product launches is between 40 percent and 80 percent. Obviously, actual profitability often does not match original expectations. Ex-post, it is likely that numerous unsuccessful licenses were overpaid with excessively high royalty rates.
- No stable profits. Typically, the launch of a new (licensed) business requires some initial investment and expenses in the early stage. Average profitability varies from the start of a licensed business until the end of its contract term. Thus, the licensee should consider average expected profitability over the term of the agreement negotiating the royalty rate.
- Profit and benefit base. There has always been some degree of disagreement on the profit base for the profit-split method. The suggested profit base ranges from fully loaded profit (net profit) over gross profit to marginal or incremental profit. The benefits of a license may be attributed to the products sold that incorporate the IP, or to components or manufacturing processes only.
- International expansion. The origins of the profit-split method—as described by Robert Goldscheider—go back to international licensing in an age of import restrictions, tariffs and entry barriers. For a company to expand internationally there was often no alternative to licensing. The licensed property was granted on an exclusive basis in the licensed territory. Today, licensing is often an approach within the same territory, for example via non-exclusive patents or brand extensions. It is not clear how this shift affects profitability and profit-split.
- Value of IP increasing. It is a well-known fact that intangibles account for an increasing share of enterprise value. Today, intangibles account for an average of 80 percent of enterprise value while 50 years ago this percentage was in the area of 25 percent. In parallel with the structure of assets and value drivers, the sources of profit changed over time. Profits generated by intangibles increased at the same rate. Today, an average of 80 percent of profits5 come from intangibles. At the origin of the profit-split concept, the 25 percent of profits generated by IP were allocated to IP. Today, the 25 percent profit-split rule allows only a fraction of IP-related profits to be allocated to IP.
Maybe these—and other—inconsistencies have been the reason for the extension of the classic profit-split concept from the initial 25 percent ratio to a larger range from 10 percent to 35 percent. But the major source of criticism of the profit-split method has always been its missing empirical evidence. The method has never been proven and confirmed—except by Robert Goldscheider’s description of the Philco case and the fact that it was widely used and accepted. Therefore, the method is more practical as a tool for licensors and licensees in royalty negotiations.
Empirical History
There have been a few attempts to provide empirical evidence for the general validity of the classic profit-split rule. The first attempt was made by Robert Goldscheider himself in 2002 to rebut the often stated criticism.6Goldscheider and his co-authors tried to compare royalty rates from thousands of actual licensing transactions with expected long-run profit margins of the products that embody the subject IP. However they admit right away that they were unable to undertake a direct comparison of product profit and royalty rates because they had no access to such data.
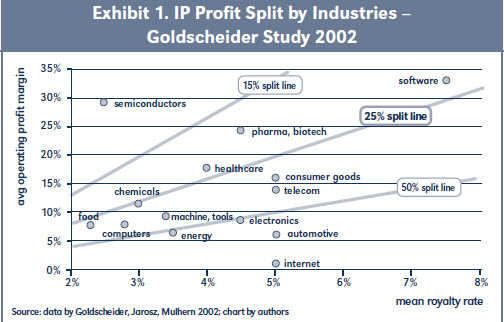
In a first step, Goldscheider et al. selected 1,533 license agreements with running royalty rates on sales, grouped them into 15 industries, and identified median royalty rates per industry. In a second step, they identified 347 licensees from the 1,533 agreements that report and disclose their financial statements. Taking the total operating income of these companies, the authors compute an average operating profit margin for the 15 industries over a period of 10 years. Then, they compare the 15 median industry royalty rates with the 15 average profit margins and find an average ratio of 27 percent.7 They conclude that the empirical analysis provides “some support” for the use of the 25 percent profit-split rule, but they also admit “that there is quite a variation in results for specific industries,” ranging from an 8.5 percent split for the semiconductor industry to an 80 percent split in the automotive industry (see exhibit 1).8 Likely, these variations would be much larger at the level of the 347 individual companies. The empirical test shows that on average the 25 percent split ratio is a good overall approximation, but the statistical variance is too high to explain the split ratios at an industry, let alone company or licensed business level.
A second attempt to analyze the relation between profitability and royalty rates was published by Kemmerer and Lu in 2008.9 They used average industry royalty rates for 14 industries compiled from 3,015 license agreements, and profitability from a fully separate sample of 3,887 companies mapped into the same 14 industries. As profitability measures they test operating profit, EBIT, EBITDA and gross profit. Interestingly, the average royalty rate in their sample is 7.0 percent, which is substantially higher than the median rate of only 4.3 percent observed by Goldscheider et al. On average they find that royalty rates account for 15 percent of gross, 41 percent of EBITDA, and 53 percent of EBIT margins. They confirm earlier findings that these overall ratios vary at industry level. Finally, they provide some limited support for the validity of the 25 percent rule based on operating profits assuming a (hypothetical) forced linear fitting between royalty rates and operating margins.
In a specification of his first study, Lu conducted a pro forma analysis based on corrected “pre-royalty” profitability data.10 In other words, he added the royalty rate on top of the profit margin, thereby assuming that the licensee considers the profitability of the licensed business before paying royalties for the IP and then applies the profit-split on this (higher) margin. Lu now finds an average profit-split of 13 percent based on gross profit, 26 percent on EBITDA and 32 percent on EBIT. Based on these results, Kemmerer concludes “The 25 percent rule still rules” and suggests starting royalty negotiations with 25 percent of EBITDA margin or 33 percent of EBIT margin. What he does not say, however, is that on this pre-royalty assumption Goldscheider’s classic rule would transform from 25 percent down to 20 percent.11 Moreover, he does not address the large bandwidth of the industry or individual value around the overall average.
From an economic point of view, it is not surprising that none of the empirical tests could provide strong evidence for the validity of the 25 percent rule as a universally valid rule of thumb.12 The difficulty with these studies is that it was not possible to analyze the royalty rate and the profitability of a licensed business from the same set of data. Typically, researchers analyzed a set of royalty rates, and a separate set of profit rates of other businesses in the same industry. There is some evidence that the overall average profit-split might well be in the area of 25 percent, depending on the profit base used. However, the variance from that average can be very large at the level of individual cases, thus the average being eventually meaningless in a specific case. The rule might still be used as some sort of a rule if the frequency distribution of the individual values around the mean value was known. This not being the case, the rule is not a rule but an average value with little relevance for a subject case. Insofar, the Court of Appeals was right to require the consideration of relevant facts and circumstances of the case at issue.
Does Profit Explain IP Value At All?
Very broadly speaking, valuation is very much oriented towards market prices or other concepts that come close to it. If market prices do not exist for an asset—which is typical for an intangible asset—the next best principles are fair value or arm’s length. Both principles try to reconstruct a hypothetical but realistic transaction between willing and unrelated parties.
Now, how does profit-split fit into these principles? According to profit-split, the price of an IP asset depends on the profitability of the business that uses this IP. If the profitability of the business is low, a hypothetical unrelated buyer would pay a low price for it, and vice versa. However, in reality, the value of the IP for the buyer might depend less on its overall profitability than on its benefit for the buyer. This raises the question if the value of IP depends on business profitability, and if this is a discrepancy between profit-split and other valuation methods? Interestingly, the valuation profession never discussed the question if there is a significant causality between business profitability and IP value. A clear yes to this question is, however, a prerequisite for the existence and future application of the profit-split method—at whatever percentage ratio. To have a closer look at this question, we have to change perspective. The question to ask is not if profitability explains the value of IP, but rather, if IP contributes to profitability, and if, so how much?
If we look for a moment at tangible assets only— PP&E, inventory, receivables, and cash—they are not profitable as such. The business must generate enough profit to pay for their depreciation. If the business wanted to sell them, it would typically earn their book value, without making a profit or a loss. If it is able to make profit on tangible assets, it is either because of speculation or these assets are currently in short supply. Thus, all tangibles sitting on the balance sheet generate the profit they have to: their depreciation and/or their cost of finance. Let us call this the base profit on book value.
Any additional profit on top of such base profit would be for assets that are not yet on the balance sheet—(unaccounted) intangibles. The value of these intangible assets would be the higher the more profitable the business. This is a very simple logic. The only difficulty is that we can’t see the value of these intangibles in the books. They are not accounted for—unless the business is acquired.
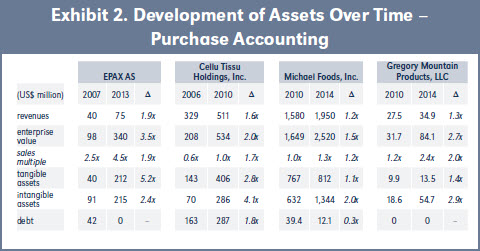
A next question is—what would happen if the profitability and the value of the business increased? From which “improved” assets would the increased profitability come from? To understand these connections better, we have a closer look at the consecutive purchase accounting of four companies that were acquired two times within a few years, and analyze how different assets developed (see Exhibit 2).13
All four cases are quite different in their profitability, asset structure and valuation multiples. EPAX is a high growth and high margin business with some tech elements; Cellu is a capacity and commodity business; Gregory is a branded consumer goods business; Michael Foods is somewhere between the latter two. In all four cases, the first acquirer created significant value before he resold the company. During their ownership, visible investments in tangible assets were made, thereby refocusing the business and increasing capacity, revenues and margins. But enterprise value grew by much more than only by these visible and accountable investments in tangibles. In all four cases, intangible assets increased as well. Higher quality, more efficient processes, increased expenses for R&D and marketing might all have contributed to the increase in intangibles. Whatever it was, the two examples show that higher profitability typically results in higher valued intangibles.
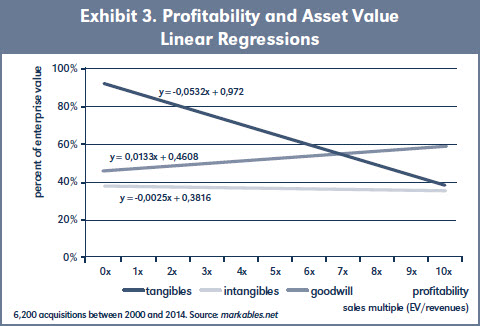
Data availability is limited for such time-series analysis; only few cases are known and reported in sufficient details. However, single values can be analyzed in large data samples from purchase accounting databases, like MARKABLES.14 Linear regression analysis illustrates how the asset structure of businesses changes with increasing profitability. The share of tangible assets within enterprise value decreases with increasing profitability, while the share of goodwill increases. Identifiable and separable intangible assets remain stable, as illustrated in Exhibit 3.15
The flat line for intangibles shows that the value of intangibles behaves proportionately with profitability. In other words—if profitability doubles, the value of intangibles will—on average—also double. Of course— this might be different for a particular business. But as an overall relationship, there is causality between profitability and the value of intangibles. This may sound simple and clear-cut, but it is an important if not vital finding for the future of the profit-split method. If this causality did not exist—like for tangible assets— profit-split would be doomed to die, not only as a 25 percent flat rule, but altogether.
Applying Profit-Split Based on Purchase Accounting Data
As stated earlier, one major problem of the classic profit-split method is data availability. Except for the few Philco licensees cited by Robert Goldscheider, profit-split could never be tested from a concise set of data. It was simply not possible to observe the value of the IP (its royalty rate) and the profit for one and the same case, because either one of the two was unknown. A license agreement shows a royalty rate, but not the profitability of the licensed business, even not its expected profitability. Even more, a licensee would be ill-advised to reveal his profit expectations to the licensor during license negotiations. Also years later, the profit & loss statement of a licensed business no longer tells what royalty rate the licensee would have accepted, had he known its later profitability.
However, meaningful profit-split data is available in substantial numbers and details from purchase accounting. Possibly, our view was clouded due to the approach of splitting profit between two parties we became so used to. Purchase accounting, which is also frequently referred to as acquisition accounting, is the process of classifying, valuing and accounting for all of the assets and liabilities that are included in the acquisition of a business. This process is rather standard for the tangibles assets and the liabilities that are already in the books of the acquired business. The difference between the book value of the acquired assets and liabilities and the purchase consideration is then allocated to the various intangible assets, and to goodwill.
Technically, the purchase consideration paid for the acquired business (or the enterprise value including net debt) is the present value of all returns it is expected to generate in the future. The valuation of the intangible assets is an allocation of these expected future returns to particular assets. Also, the present value of any intangible asset at the date of the acquisition relates to its share of total future returns that are expected from that business. This reads like the nearly perfect profit-split for intangibles and, in fact, it comes very close to it. The results from purchase accounting—purchase price allocations on business combinations—are reported manifold in the financial statements of public companies. Exhibit 4 illustrates how to compute profit-split data from the results of a purchase price allocation. In this particular business, 38 percent of future profits are expected to come from (existing) customer relations, 17 percent from product technology and 4 percent from trade names.
The data applied to the more classic profit-split methods mean that Life Technologies would be willing to pay 21.6 percent of its profits as a royalty to license-in product technology, trademarks and in-process research, or as a royalty relief for IP which it owns and hence does not need to license.16 Moreover, Life Technologies would likely not pay a royalty for customer relations because these are typically owned and cannot be licensed-in.
The use of such data is compellingly convincing. Still, the following limitations should be noted:
- Useful life. Intangibles assets have different useful lives. For an intangible asset with a short useful life, its profits are expected to be generated faster, and vice versa for an intangible asset with very long or indefinite life. A 10 percent profit-split with a useful life of 10 years means a higher profit margin (for the next 10 years) than a 10 percent profit-split over 20 years.
- Fair value. The value of an intangible asset as stated in the purchase price allocation (PPA) is its fair value, not its market value or market price.17 It is thus the result of a fair value calculation. Still, it comes close to the willingness of the acquirer to pay for this particular asset, based on a real transaction of ownership of the subject business in total and on a going concern premise. Based on this real transaction, the fair values for particular intangibles can serve as a meaningful approximation for “market” prices that would be paid for such intangibles.
- Different use. The data represents the view of the acquirer, not the previous owner. If the acquirer intends to restructure the business, or if he has only little use for a particular intangible, he might allocate only little value to it, while this particular asset had a higher value to the previous owner, and vice versa.
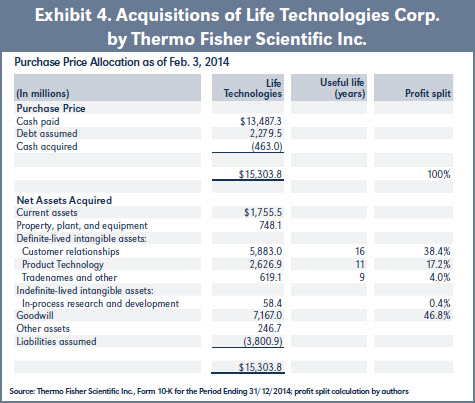
- Purchase premium. Corporate acquisitions typically involve a purchase premium over the share price paid before the acquisition was announced. Such premiums are justifiable with additional synergies resulting from the combination integration of two businesses. The premium paid for the acquisition of Life Technologies (Exhibit 4) was 12 percent. On average, purchase premiums amount to 34 percent.18 Compared to running businesses, PPA accounting thus results in a higher 100 percent base (higher enterprise value), higher goodwill, and lower intangibles.
- Tax. The value of intangibles and goodwill can vary for its tax deductibility. Tax deductibility results in a higher value and in an interest-free tax liability of the same amount, and thus in a higher profit-split percentage. Typically, this information can be found with the PPA. In the case illustrated in Exhibit 4, neither intangibles nor goodwill are deductible for tax purposes.
On the other hand, the benefits of profit-split based on purchase accounting data are quite obvious:
- Data availability. Numerous data are available in the public domain and fully open to scrutiny.
- Data quality. Data are calculated according to national and international accounting standards. Moreover, results of valuations are cross-checked relative to each other and against the 100 percent threshold of purchase consideration effectively paid. Finally, data are audited by CPAs.
- Transaction-based. Data result from real market transactions on M&A markets where market conditions are more “perfect” than on licensing markets.
Prices paid are based on bidding processes, commonly accepted
valuation multiples and on thorough due diligence. - Established businesses. Businesses covered are fully established and reliably assessable. This compares to licensed businesses which are new and risky at the effective date of the license agreement, and often fail to succeed.
- Profits from long-term ownership. Profitability is based on expected long-term, fully loaded profits to acquire and own the intangible. This is a more realistic concept than profits
under a short-term lease agreement. - Integrated data. Last but not least, the method is based on integrated data. Both price (value) of intangibles and profit-split relate to one and the same business.
A Reconciliation of the Classic Profit-Split Method
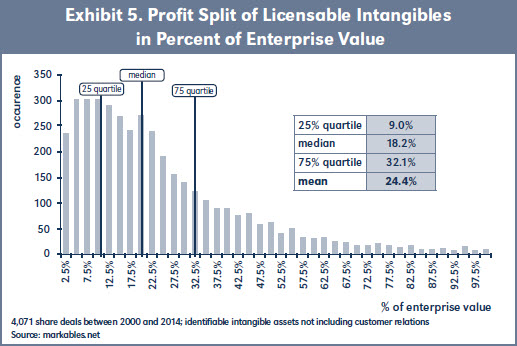
Using data from purchase accounting as comparables for profit-split valuation is a new approach. Now, it would be interesting to see how such data compare to the earlier attempts to verify the validity of the classic profit-split method. The following analysis is based on data taken from the MARKABLES database.19 The profit-split for the sum of licensable intangibles was analyzed as a percent of enterprise value. Licensable intangibles were defined as identifiable intangibles not including such intangibles that are typically not licensable (for example customer relations, customer contracts or backlog). The findings are illustrated in Exhibit 5.
Interestingly, the findings provide strong evidence for Robert Goldscheider’s early observations. The mean profit-split of licensable intangibles is 24.4 percent, thus very close to Goldscheider’s 25 percent observation. This finding is good for both Goldscheider, whose classic rule receives some sort of reconciliation, and for the purchase accounting-based method which shows mean values very similar to those found in the earlier research performed by Goldscheideret al. and Kemmerer/Lu. It must be noted that these findings relate to the sum of all (hypothetically) licensable intangibles a company owns or uses.
But beyond that 25 percent mean value, the findings also show the large bandwidth of individual data. 50 percent of all cases are situated somewhere between a 9 percent and a 32 percent profit-split. The other 50 percent of the cases have profit ratios even below or above these percentages. Obviously, there exist many businesses that need very little if any licensable intangibles to operate, and there are others whose value structure is driven to a very large extent by such intangibles. This is exactly what the Court of Appeals found and ruled in the Uniloc decision. Business reality is far too diverse to be mapped with averages or narrow ranges.
Trademark Profit-Split
Profit-split in the original Philco case—and in many cases thereafter—was based on a bundle of different IP rights, including patents, know how, trade names, and copyrights. This bundling seems to be usual practice in IP licensing. Out of 13,078 license agreements with unredacted running royalty rates listed in the RoyaltySource database, 83 percent comprise bundles of various IP rights, and no more than 13 percent are pure play license agreements covering one specific IP only.20 However, IP valuation and litigation is often about one particular IP; the bundle is more typical in transfer pricing for subsidiaries. The following discussion takes a closer look at the valuation of one particular intangible asset, namely trademarks (or brands).
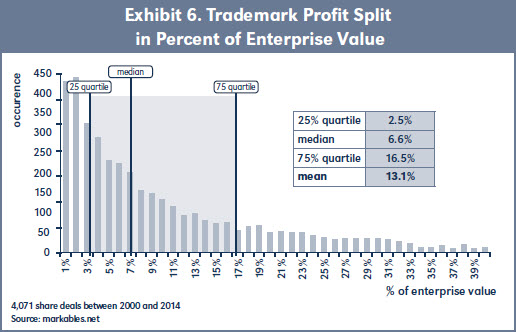
Exhibit 6 illustrates the frequency distribution of trademark profit-split which— being a part of the total licensable asset bundle—must necessarily be lower (further left) than the distribution for all intangibles in exhibit 5. The analysis shows that trademarks (or brands) account for an average of 13.1 percent of enterprise value or future profits. The median of the distribution is 6.6 percent. With regard to the classic profit-split rule of 25 percent, this would be far too high to be applied as a rule of thumb on a pure play trademark alone. Again, the bandwidth over all different trademarks in the sample is very high, ranging from close to zero up to over 100 percent.21
It is immediately clear that a brand of Swiss luxury watches must make a much higher contribution to profit than the trade name of an oil well drilling business in Idaho. Or in the case of a natural cat litter business, the value of the brand accounts for nearly 100 percent of enterprise value; the business sources the packaged products from a quarry mill nearby; it has no own production or technology, and no relations to end customers. Almost all of its enterprise value is driven by the brand. As the Court of Appeals concluded in Uniloc, “evidence …must be tied to the relevant facts and circumstances of the particular case at issue.”
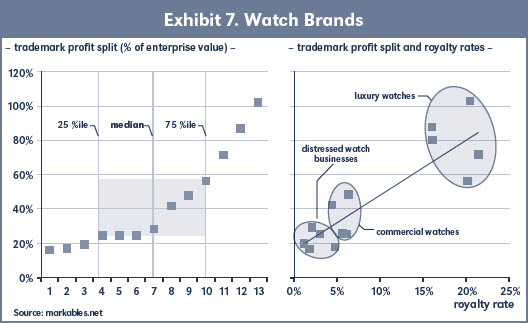
To further illustrate this, a peer group analysis of trade-mark profit-split in the watch making business based on purchase accounting data was performed (see Exhibit 7). Watches are generally known to be highly brand driven and to generate attractive profit margins. The peer group includes thirteen different watch brands of which seven are based in Switzerland, five in the U.S., and one in Germany.
Obviously, the profit-split ratios for the thirteen watch businesses show a wide range from 16 percent to 102 percent (Exhibit 7, left part). The 25-75 quartiles range from 25 percent to 56 percent, the median is 29 percent. Towards the high end of the distribution, the curve shows a steep increase. This particular peer group—as any other peer group—shows that industry or category specific profit-split ratios do not exist. Too different are the value driver and profitability structures at a company level, even within one and the same industry.
Further analysis reveals however a strong relation between trademark profit-split and royalty rates (Exhibit 7, right part). The higher the profit-split ratio, the higher the royalty rate which the trademark generates on revenues. When looking closer at the same thirteen watch businesses, a clear segmentation appears. Luxury watches during normal course of business show both high profit-split ratios and high royalty rates. Commercial or fashion watches show medium profit-split ratios and royalty rates. The third segment comprises watch businesses in a turn-around situation. Considering the retail prices of the watches in that segment, they belong to the premium/ luxury segment; considering their weak profitability however, their accounts leave no room for high trademark values. Thus, trademark profit-split becomes a major determinant of trademark value in connection with other determinants like royalty rate and overall profit margins. Similar trademark analyses can be performed for most categories or industries.
The application of such profit-split analyses is not limited to the valuation of intangible assets; it is also helpful in transfer pricing issues between subsidiary companies of a large corporation. Profit-split shows the consolidated profit of the group which is attributable to a particular intangible asset (like trademark). Based thereupon, a functional analysis of trademark-related functions performed by the IP holding entity and the subsidiaries provides a further allocation of overall trademark profit onto different group entities.
Conclusion
Purchase accounting data is helpful to gain a deep understanding of the transaction values of intangible assets, and their expected contribution to future prof-its of the acquired businesses. Such data is helpful to reconcile and redirect the profit-split method which has long been an important method for valuing intangible assets. With ample purchase accounting data available as comparables in the public domain, in-depth case-specific peer group analyses become possible. This will not only improve the quality of the profit-split method itself, but also make an important contribution to the overall accuracy of the valuation of intangibles in general.
*This article is based on an earlier version published in Valuation Strategies, Vol. 14, July-August 2015, and reprinted with permission.
- Uniloc USA, Inc. v. Microsoft Corp., 632 F.3d 1292, (CA-F.C., 2011).
- Gordon Smith and Russell Parr: Valuation of Intellectual Property and Intangible Assets, 3rd ed.(John Wiley & Sons, 2000) pages 401- 403; Emmanuel Llinares and Nihan Mert Beydilli: “How to Determine Trade Marks Royalties,” International Tax Review12 (December 2006) pages 29-30; Mark Zyla: Fair Value Measurement: Practical Guidance and Implementation, 2nd ed. (John Wiley & Sons 2012), pages 288-293; Robert Reilly and Robert Schweihs, Guide to Intangible Asset Valuation (AICPA 2013) pages 311-312.
- For a detailed description see Robert Goldscheider: “The Classic 25 percent Rule and The Art of Intellectual Property Licensing,” 46 les Nouvelles 148 (September 2011), pages 151-153.
- Uniloc USA, Inc. v. Microsoft Corp., 632 F.3d 1292, (CA-F.C., 2011), page 1055.
- Or more, depending on the required return rates on tangibles and intangibles.
- Robert Goldscheider, John Jarosz and Carla Mulhern, “Use Of The 25 Percent Rule in Valuing IP,” 37 les Nouvelles 123 (December 2002).
- Using data from successful licensees only.
- This range does not include the media and entertainment and the internet industry. Here, long-term industry profitability as far below median royalty rates, resulting in flawed ratios.
- Jonathan Kemmerer and Jiaqing Lu, “Profitability and Royalty Rates Across Industries: Some Preliminary Evidence,” 8 Journal of the Academy of Business and Economics (March 2008).
- Jiaqing Lu, “The 25 Percent Rule Still Rules–New Evidence from Pro Forma Analysis in Royalty Rates,” 46 les Nouvelles (March 2011).
- 25/100 versus 25/(100+25).
- A detailed discussion of the empirical tests was published by Douglas Kidder and Vincent O’Brien, “Simply Wrong: The 25 Percent Rule Examined,” 46 les Nouvelles 263 (December 2011).
- Norwegian EPAX AS, a supplier of Omega-3 fish oils, was acquired in 2007 by Austevoll Seafood ASA, and then in 2013 by FMC Corporation. Cellu Tissu is a manufacturer of specialty tissue paper for use in personal hygiene products. Cellu Tissu was acquired in 2006 by Weston Presidio (an investment firm), and in 2010 by Clearwater Paper. Michael Foods is a supplier of specialized egg and potato products to retail and food service. It was acquired in 2010 by Goldman Sachs, and again in 2014 by Post Holdings. Gregory Mountain Products is a leader in technical backpacks for climbing and hiking. It was acquired in 2010 by Clarus and combined with Black Diamond Equipment, and in 2014 by Samsonite.
- MARKABLES is a database containing data from over 7,500 PPAs, with a particular focus on trademark and brand assets. www.markables.net.
- The three lines do add up to more than 100 percent due to non-interest bearing liabilities. Such liabilities decrease with increasing profitability.
- 17.2 percent + 4.0 percent + 0.4 percent = 21.6 percent
- For a comprehensive and detailed overview of fair value accounting, see Mark Zyla: Fair Value Measurement: Practical Guidance and Implementation, 2nd ed. (John Wiley & Sons 2012).
- See Paul Komiak, “Control Premiums: Evidence against market integration,” in: 3 Journal of Business Valuation and Economic Loss Analysis (January 2010).
- MARKABLES is a database containing data from over 7,500 PPAs, with a particular focus on trademark and brand assets. www.markables.net.
- Ednaldo Silva, “Letter in Reply to OECD on Transfer Pricing Comparability Data and Developing Countries,” April 11, 2014. Accessed at http://www.oecd.org/ctp/transfer-pricing/ royaltystatllc-conparability-and-developing-countries.pdf.
- The graph is cut at 40 percent.


